Starbucks
Rmkdown
Reading the excel file
## Importing the datalibrary(readxl)library(ggplot2)library(Hmisc)library(tidyverse)library(dplyr)library(rpart.plot)library(randomForest)library(tidyr)library(party)starbuck<- read_excel("F:/schoolwork files/portfolio projects/datasets/starbucks_drinks.xlsx")#Displaying the datasetprint.data.frame(head(starbuck))## Beverage_category Beverage Beverage_prep Calories
## 1 Coffee Brewed Coffee Short 3
## 2 Coffee Brewed Coffee Tall 4
## 3 Coffee Brewed Coffee Grande 5
## 4 Coffee Brewed Coffee Venti 5
## 5 Classic Espresso Drinks Caffè Latte Short Nonfat Milk 70
## 6 Classic Espresso Drinks Caffè Latte 2% Milk 100
## Total Fat (g) Trans Fat (g) Saturated Fat (g) Sodium (mg)
## 1 0.1 0.0 0.0 0
## 2 0.1 0.0 0.0 0
## 3 0.1 0.0 0.0 0
## 4 0.1 0.0 0.0 0
## 5 0.1 0.1 0.0 5
## 6 3.5 2.0 0.1 15
## Total Carbohydrates (g) Cholesterol (mg) Dietary Fibre (g) Sugars (g)
## 1 5 0 0 0
## 2 10 0 0 0
## 3 10 0 0 0
## 4 10 0 0 0
## 5 75 10 0 9
## 6 85 10 0 9
## Protein (g) Vitamin A (% DV) Vitamin C (% DV) Calcium (% DV) Iron (% DV)
## 1 0.3 0.0 0 0.00 0
## 2 0.5 0.0 0 0.00 0
## 3 1.0 0.0 0 0.00 0
## 4 1.0 0.0 0 0.02 0
## 5 6.0 0.1 0 0.20 0
## 6 6.0 0.1 0 0.20 0
## Caffeine (mg)
## 1 175
## 2 260
## 3 330
## 4 410
## 5 75
## 6 75
Data Cleaning
To Clean the data, I would check for missing values in the dataframe, in this example below, I notice there are missing values in the dataframe. So, what I did was use the mean value imputation for the “caffeine column”
#Checking for missing values in the dataframecolSums(is.na(starbuck)) #Caffeine has a missing value so we will use mean imputation## Beverage_category Beverage Beverage_prep
## 0 0 0
## Calories Total Fat (g) Trans Fat (g)
## 0 0 0
## Saturated Fat (g) Sodium (mg) Total Carbohydrates (g)
## 0 0 0
## Cholesterol (mg) Dietary Fibre (g) Sugars (g)
## 0 0 0
## Protein (g) Vitamin A (% DV) Vitamin C (% DV)
## 0 0 0
## Calcium (% DV) Iron (% DV) Caffeine (mg)
## 0 0 1
imputed_data <- impute(starbuck$`Caffeine (mg)`, fun=mean)## Warning in mean.default(x[!m]): argument is not numeric or logical: returning
## NA
Notice that this column has “varies” in the vector. To clean that part up, I would just delete the rows since caffeine can vary. The drink could be low in caffeine or very high in caffeine
starbuck <- starbuck[!(starbuck$`Caffeine (mg)` == "varies"), ]
starbuck <- starbuck[!starbuck$`Caffeine (mg)` %in% c("Varies", "NA"), ]
starbuck$`Caffeine (mg)`
##   [1] "175" "260" "330" "410" "75"  "75"  "75"  "75"  "75"  "75"  "150" "150"
##  [13] "150" "150" "150" "150" "85"  "85"  "85"  "95"  "95"  "95"  "175" "175"
##  [25] "175" "180" "180" "180" "75"  "75"  "75"  "75"  "75"  "75"  "150" "150"
##  [37] "150" "150" "150" "150" "75"  "150" "225" "300" "75"  "75"  "75"  "75"
##  [49] "75"  "75"  "150" "150" "150" "150" "150" "150" "75"  "150" "75"  "75"
##  [61] "150" "150" "75"  "75"  "75"  "75"  "75"  "75"  "150" "150" "150" "150"
##  [73] "150" "150" "75"  "75"  "75"  "75"  "75"  "75"  "150" "150" "150" "150"
##  [85] "150" "150" "10"  "10"  "10"  "20"  "20"  "20"  "25"  "25"  "25"  "30"
##  [97] "30"  "30"  "0"   "0"   "0"   "0"   "50"  "50"  "50"  "70"  "70"  "70"
## [109] "95"  "95"  "95"  "120" "120" "120" "25"  "25"  "25"  "55"  "55"  "55"
## [121] "80"  "80"  "80"  "110" "110" "110" "0"   "0"   "0"   "0"   "0"   "0"
## [133] "0"   "0"   "0"   "0"   "0"   "0"   "120" "165" "235" "90"  NA    "90"
## [145] "90"  "125" "125" "125" "170" "170" "170" "15"  "15"  "15"  "0"   "0"
## [157] "0"   "0"   "0"   "0"   "70"  "70"  "70"  "95"  "95"  "95"  "130" "130"
## [169] "130" "70"  "70"  "110" "110" "110" "140" "140" "140" "70"  "70"  "70"
## [181] "100" "100" "100" "130" "130" "130" "75"  "75"  "75"  "110" "110" "110"
## [193] "145" "145" "145" "70"  "95"  "120" "70"  "95"  "130" "65"  "90"  "120"
## [205] "70"  "105" "165" "0"   "0"   "0"   "0"   "0"   "0"   "0"   "0"   "0"
## [217] "0"   "0"   "0"   "0"
starbuck$`Caffeine (mg)`[is.na(starbuck$`Caffeine (mg)`)] <- as.numeric(names(which.max(table(starbuck$`Caffeine (mg)`))))
Delete the Vitamin A, Vitamin C, Calcium, and Iron columns
drop<-c("Vitamin A (% DV)","Vitamin C (% DV)", "Calcium (% DV)", "Iron (% DV)")starbuck = starbuck[,!(names(starbuck) %in% drop)]Checking the type of variables, what category they fall into
lapply(starbuck, class)## $Beverage_category
## [1] "character"
##
## $Beverage
## [1] "character"
##
## $Beverage_prep
## [1] "character"
##
## $Calories
## [1] "numeric"
##
## $`Total Fat (g)`
## [1] "numeric"
##
## $`Trans Fat (g)`
## [1] "numeric"
##
## $`Saturated Fat (g)`
## [1] "numeric"
##
## $`Sodium (mg)`
## [1] "numeric"
##
## $`Total Carbohydrates (g)`
## [1] "numeric"
##
## $`Cholesterol (mg)`
## [1] "numeric"
##
## $`Dietary Fibre (g)`
## [1] "numeric"
##
## $`Sugars (g)`
## [1] "numeric"
##
## $`Protein (g)`
## [1] "numeric"
##
## $`Caffeine (mg)`
## [1] "character"
Since the caffeine column is character, I’ll convert to numeric
starbuck$`Caffeine (mg)`<-as.numeric(starbuck$`Caffeine (mg)`Replacing All NA’s using mean imputation
starbuck$Calories[is.na(starbuck$Calories)]<-mean(starbuck$Calories,na.rm=TRUE)starbuck$`Total Fat (g)`[is.na(starbuck$`Total Fat (g)`)]<-mean(starbuck$`Total Fat (g)`,na.rm=TRUE)starbuck$`Trans Fat (g)`[is.na(starbuck$`Trans Fat (g)`)]<-mean(starbuck$`Trans Fat (g)`,na.rm=TRUE)starbuck$`Saturated Fat (g)`[is.na(starbuck$`Saturated Fat (g)`)]<-mean(starbuck$`Saturated Fat (g)`,na.rm=TRUE)starbuck$`Sodium (mg)`[is.na(starbuck$`Sodium (mg)`)]<-mean(starbuck$`Sodium (mg)`,na.rm=TRUE)starbuck$`Total Carbohydrates (g)`[is.na(starbuck$`Total Carbohydrates (g)`)]<-mean(starbuck$`Total Carbohydrates (g)`,na.rm=TRUE)starbuck$`Cholesterol (mg)`[is.na(starbuck$`Cholesterol (mg)`)]<-mean(starbuck$`Cholesterol (mg)`,na.rm=TRUE)starbuck$`Dietary Fibre (g)`[is.na(starbuck$`Dietary Fibre (g)`)]<-mean(starbuck$`Dietary Fibre (g)`,na.rm=TRUE)starbuck$`Protein (g)`[is.na(starbuck$`Protein (g)`)]<-mean(starbuck$`Protein (g)`,na.rm=TRUE)starbuck$`Sugars (g)`[is.na(starbuck$`Sugars (g)`)]<-mean(starbuck$`Sugars (g)`,na.rm=TRUE)Now, there are no NA’s in the continous predictors. Caffeine has a missing value so we will use mean imputation
colSums(is.na(starbuck))## Beverage_category Beverage Beverage_prep
## 1 1 1
## Calories Total Fat (g) Trans Fat (g)
## 0 0 0
## Saturated Fat (g) Sodium (mg) Total Carbohydrates (g)
## 0 0 0
## Cholesterol (mg) Dietary Fibre (g) Sugars (g)
## 0 0 0
## Protein (g) Caffeine (mg)
## 0 0
# Generate column plotpar(mfrow = c(1,2))hist(starbuck$Calories, xlab = "Calories", main = "Frequency histogram")hist(starbuck$'Saturated Fat (g)', xlab = "Weight", main = "Probability histogram", probability = T)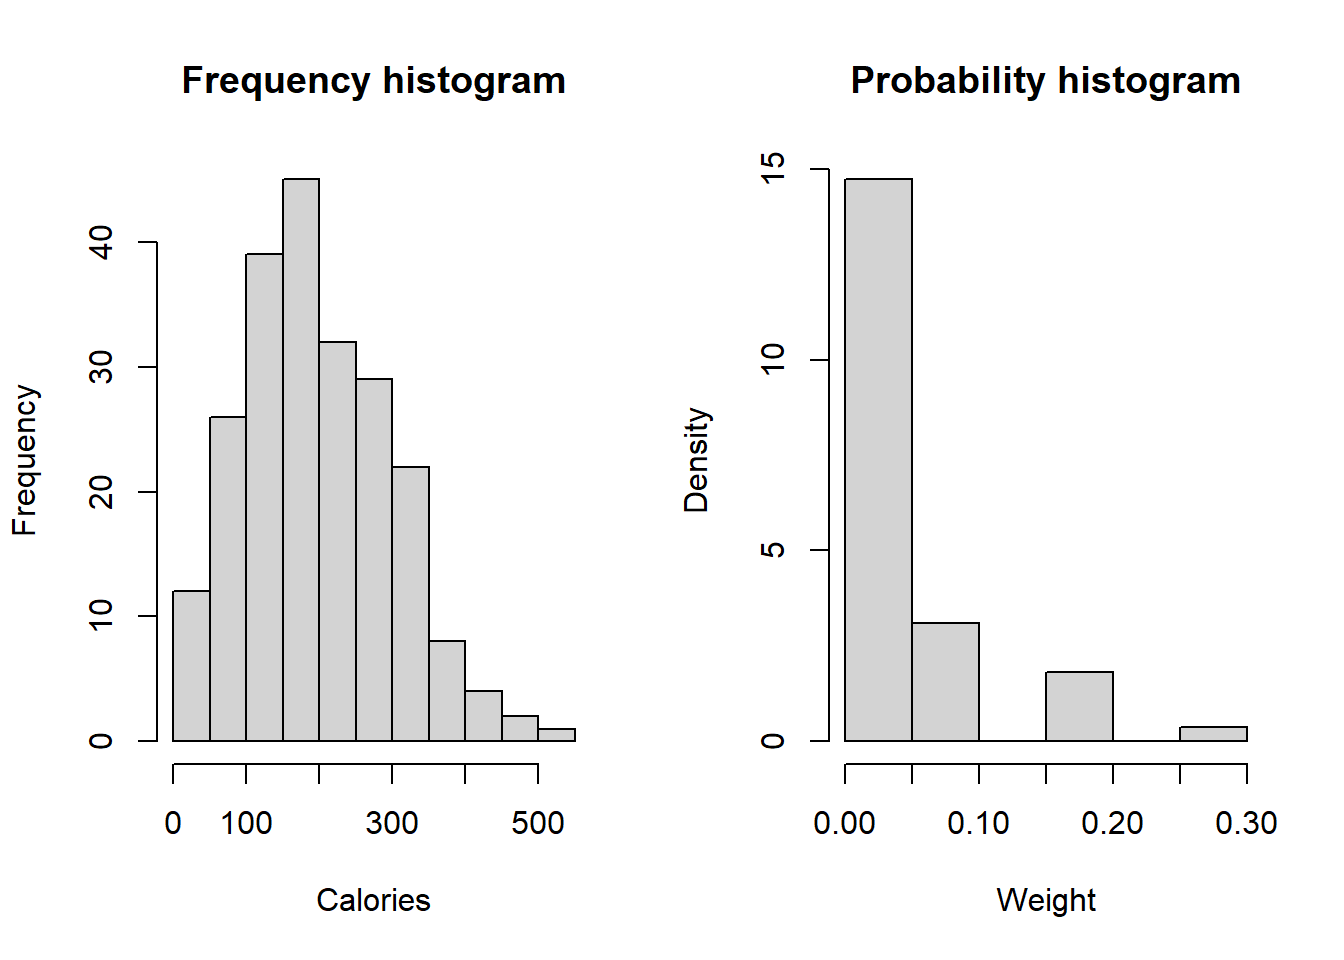
hist(starbuck$Calories, main='Histogram of Points', xlab='Points', col='steelblue', breaks=12)hist(starbuck$`Total Fat (g)`, main='Histogram of Total Fat', xlab='Total Fat', col='steelblue', breaks=12)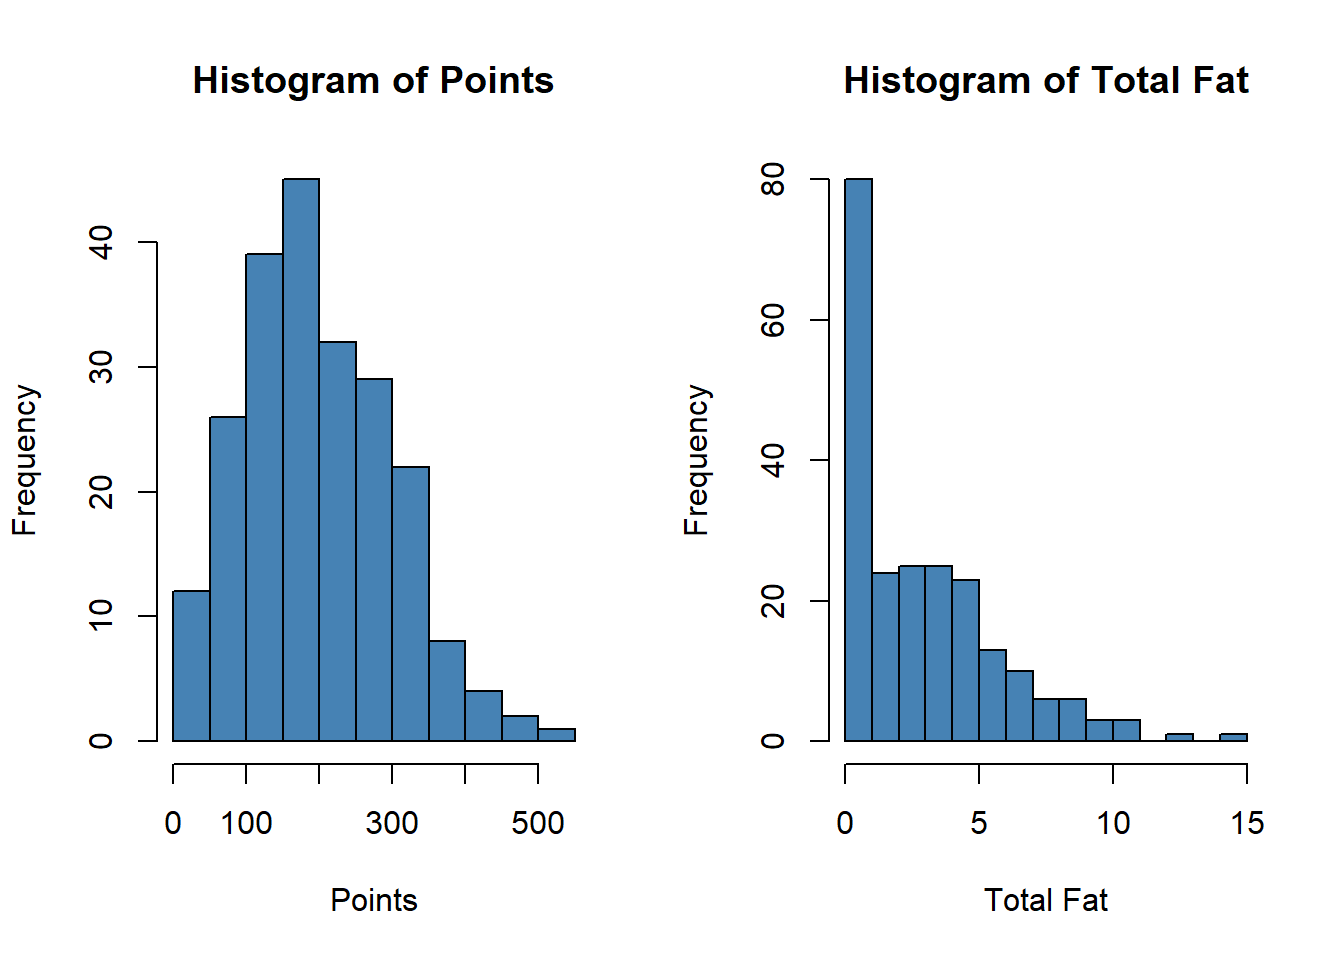
as.numeric(as.character(starbuck$`Total Fat (g)`))## [1] 0.100000 0.100000 0.100000 0.100000 0.100000 3.500000 2.500000
## [8] 0.200000 6.000000 4.500000 0.300000 7.000000 5.000000 0.400000
## [15] 9.000000 7.000000 1.500000 4.000000 3.500000 2.000000 6.000000
## [22] 5.000000 2.500000 8.000000 7.000000 3.000000 11.000000 9.000000
## [29] 0.100000 3.500000 2.500000 0.200000 5.000000 4.000000 0.300000
## [36] 6.000000 5.000000 0.300000 9.000000 7.000000 0.000000 0.000000
## [43] 0.000000 0.000000 0.100000 3.000000 1.500000 0.100000 3.500000
## [50] 3.000000 0.200000 4.000000 3.500000 0.200000 6.000000 4.500000
## [57] 0.000000 0.000000 0.100000 0.200000 0.300000 0.300000 1.000000
## [64] 4.000000 3.000000 1.000000 5.000000 4.500000 1.000000 7.000000
## [71] 5.000000 1.000000 8.000000 7.000000 3.000000 6.000000 5.000000
## [78] 4.500000 9.000000 8.000000 6.000000 11.000000 10.000000 7.000000
## [85] 15.000000 13.000000 1.500000 4.500000 3.500000 2.000000 7.000000
## [92] 6.000000 2.500000 9.000000 7.000000 3.000000 11.000000 9.000000
## [99] 0.000000 0.000000 0.000000 0.000000 0.100000 2.000000 1.500000
## [106] 0.200000 3.500000 2.500000 0.200000 4.500000 3.500000 0.300000
## [113] 6.000000 4.500000 0.200000 4.000000 3.000000 0.400000 6.000000
## [120] 4.500000 0.500000 8.000000 6.000000 0.500000 10.000000 8.000000
## [127] 0.100000 2.000000 1.500000 0.100000 3.000000 2.500000 0.200000
## [134] 4.000000 3.500000 0.200000 5.000000 4.000000 0.000000 0.100000
## [141] 0.100000 0.100000 3.074886 1.000000 0.100000 1.500000 1.000000
## [148] 0.100000 2.000000 1.500000 0.000000 5.000000 4.500000 1.000000
## [155] 1.500000 1.500000 1.000000 2.000000 2.000000 0.100000 2.500000
## [162] 1.500000 0.100000 3.000000 1.500000 0.100000 5.000000 2.500000
## [169] 0.500000 3.000000 2.000000 1.000000 4.000000 2.500000 1.000000
## [176] 6.000000 3.000000 0.100000 2.500000 1.500000 0.100000 3.500000
## [183] 1.500000 0.100000 5.000000 2.500000 3.000000 5.000000 4.000000
## [190] 4.000000 7.000000 6.000000 5.000000 10.000000 8.000000 0.100000
## [197] 0.100000 0.100000 0.500000 1.000000 1.000000 0.100000 0.100000
## [204] 0.100000 3.000000 4.000000 5.000000 0.100000 3.000000 1.500000
## [211] 0.200000 4.000000 2.000000 0.200000 6.000000 3.200000 0.100000
## [218] 3.500000 1.500000 0.100000
# Trans fat is the bad column that won't plot


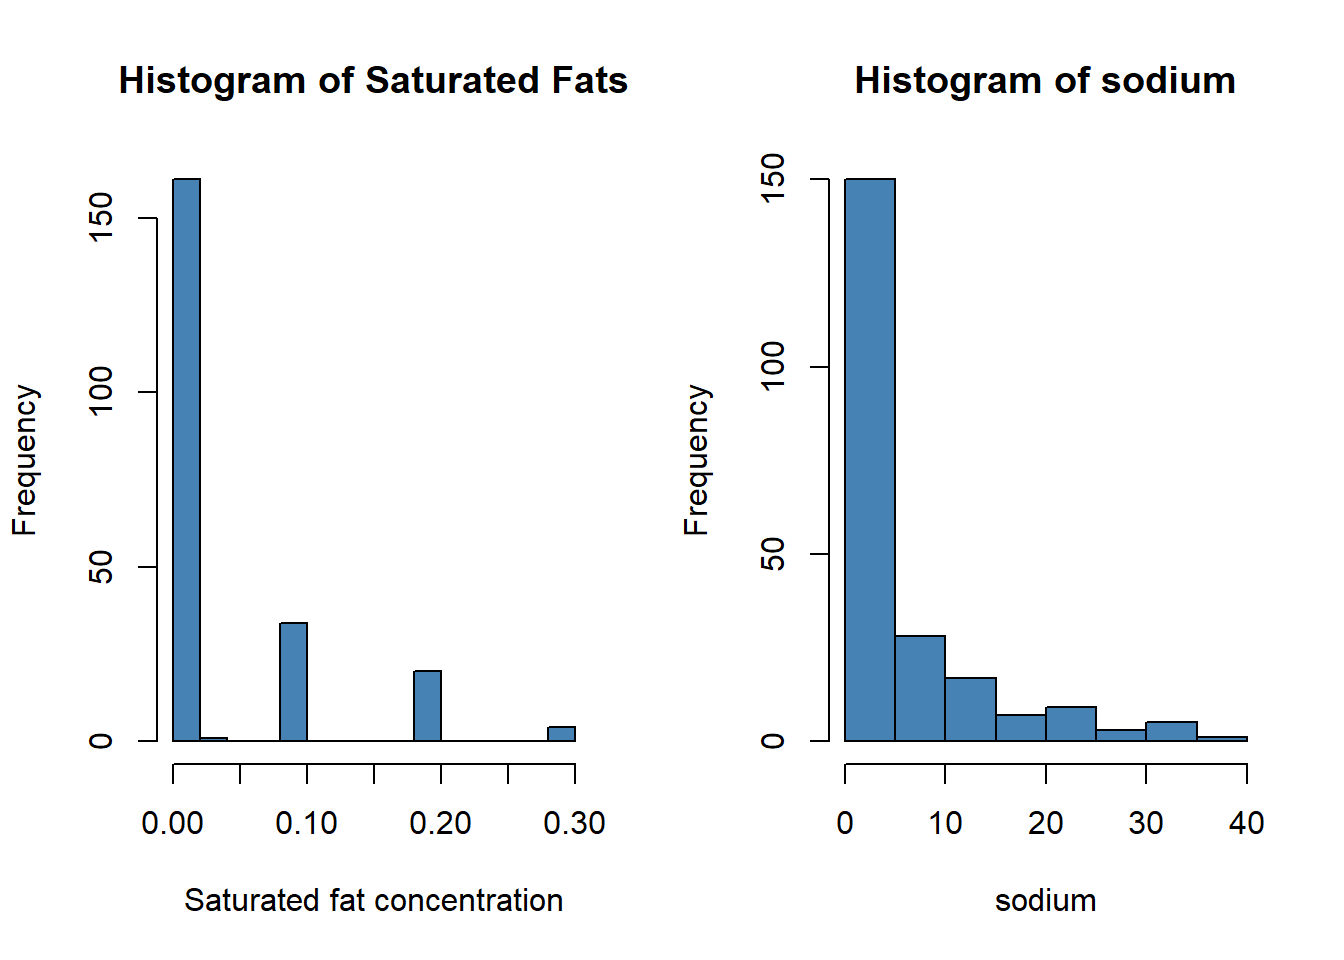
hist(starbuck$`Saturated Fat (g)`, main='Histogram of Saturated Fats', xlab='Saturated fat concentration', col='steelblue', breaks=12)
hist(starbuck$`Sodium (mg)`, main='Histogram of sodium', xlab='sodium', col='steelblue', breaks=12)
#hist(starbuck$`Total Carbohydrates (g) `, main='XXX', xlab='XXX', col='steelblue', breaks=12)hist(starbuck$`Cholesterol (mg)`, main='Histogram of cholesterol', xlab='Cholesterol concentration', col='steelblue', breaks=12)hist(starbuck$`Dietary Fibre (g)`, main='Histogram of fiber', xlab='fiber (g)', col='steelblue', breaks=12)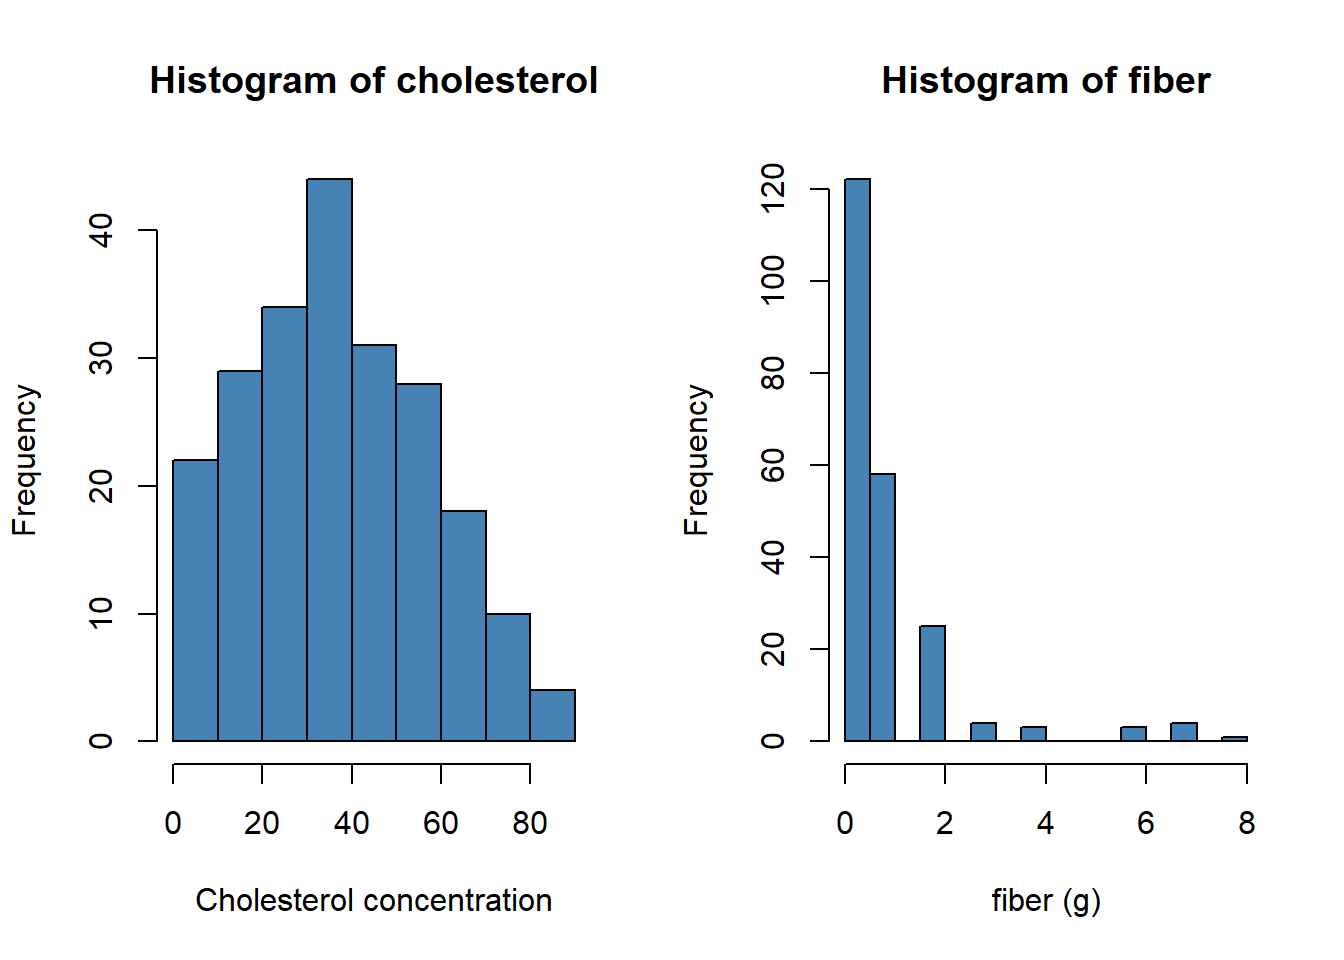
hist(starbuck$`Caffeine (mg)`, main='Histogram of caffeine', xlab='Caffeine (mg) concentration', col='steelblue', breaks=12)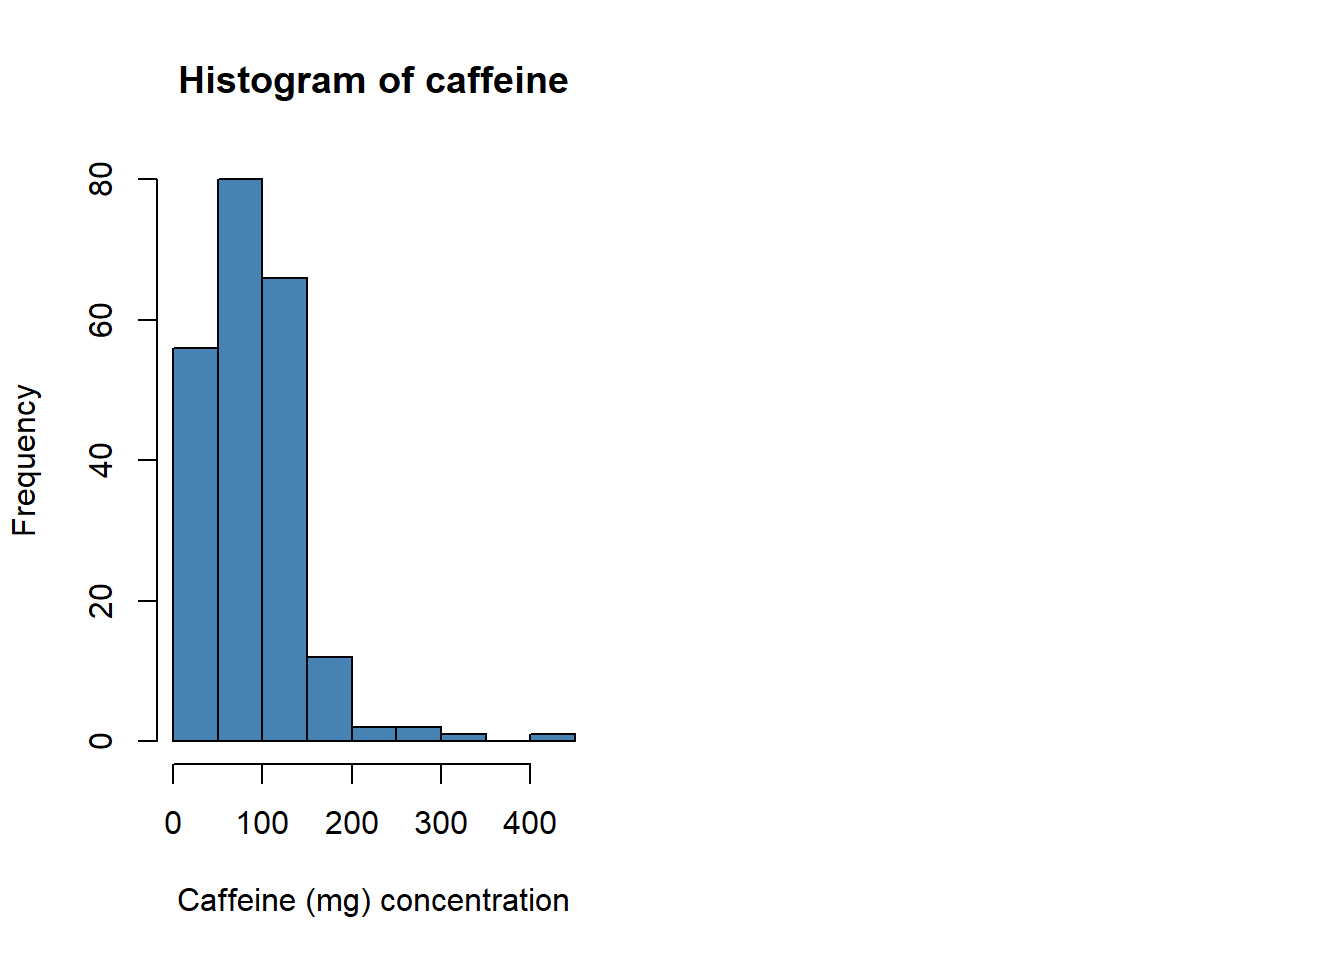
Which drinks have the most sugar, caffeine, and calories?
Calories
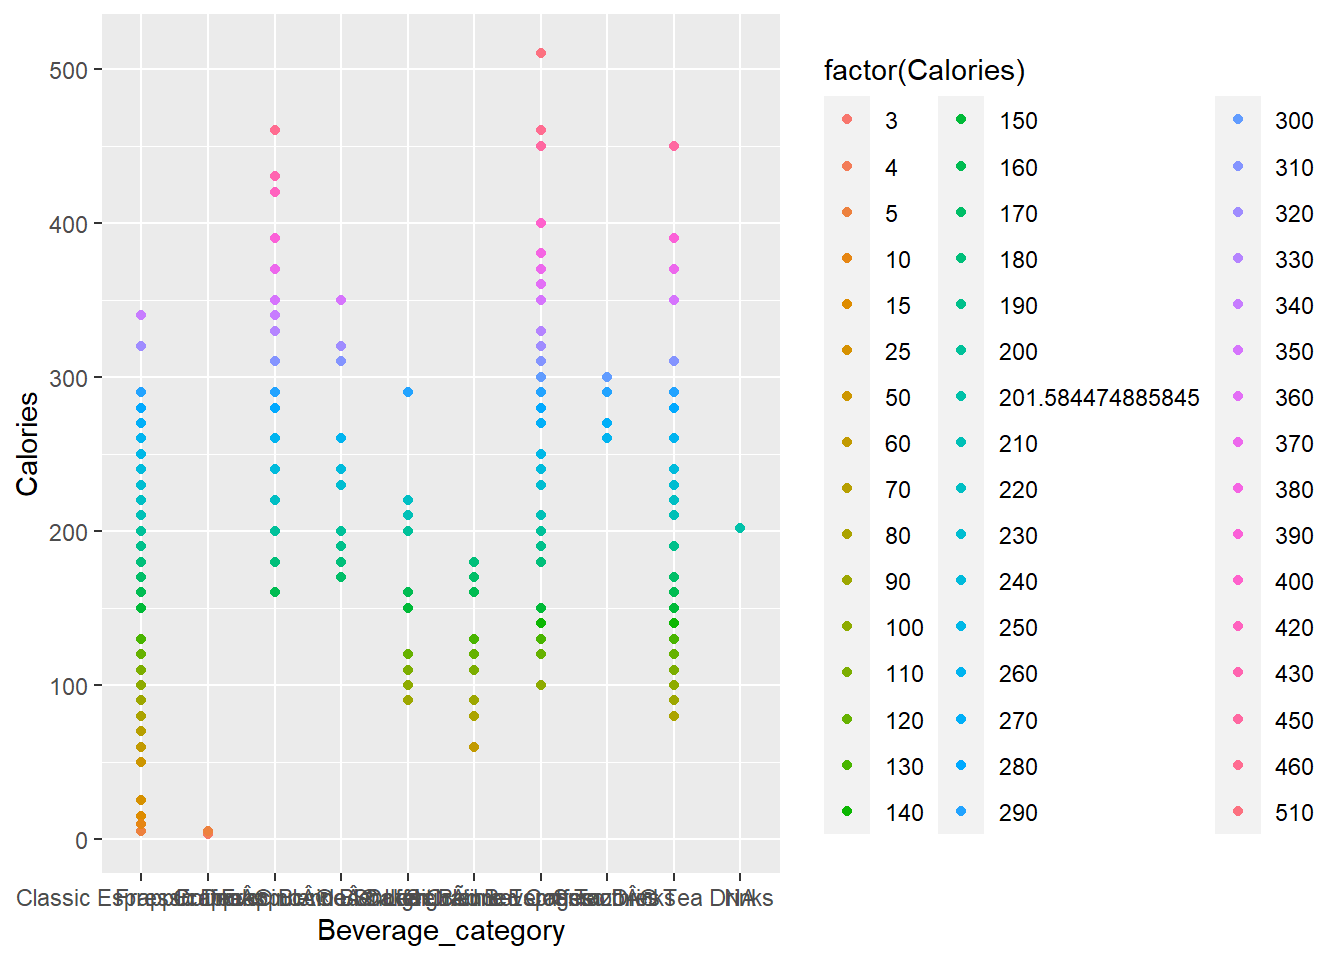
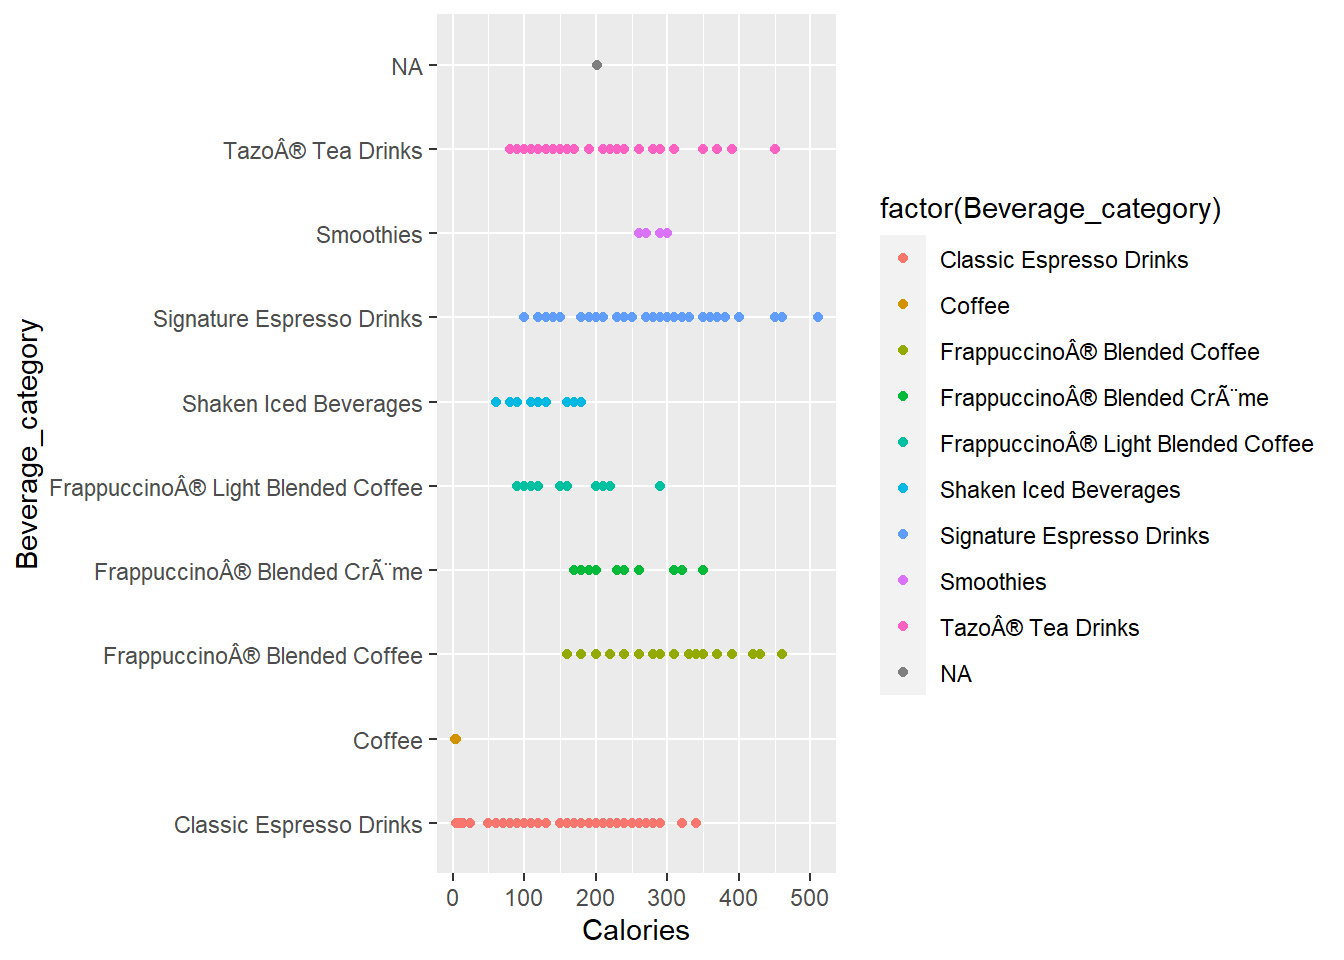
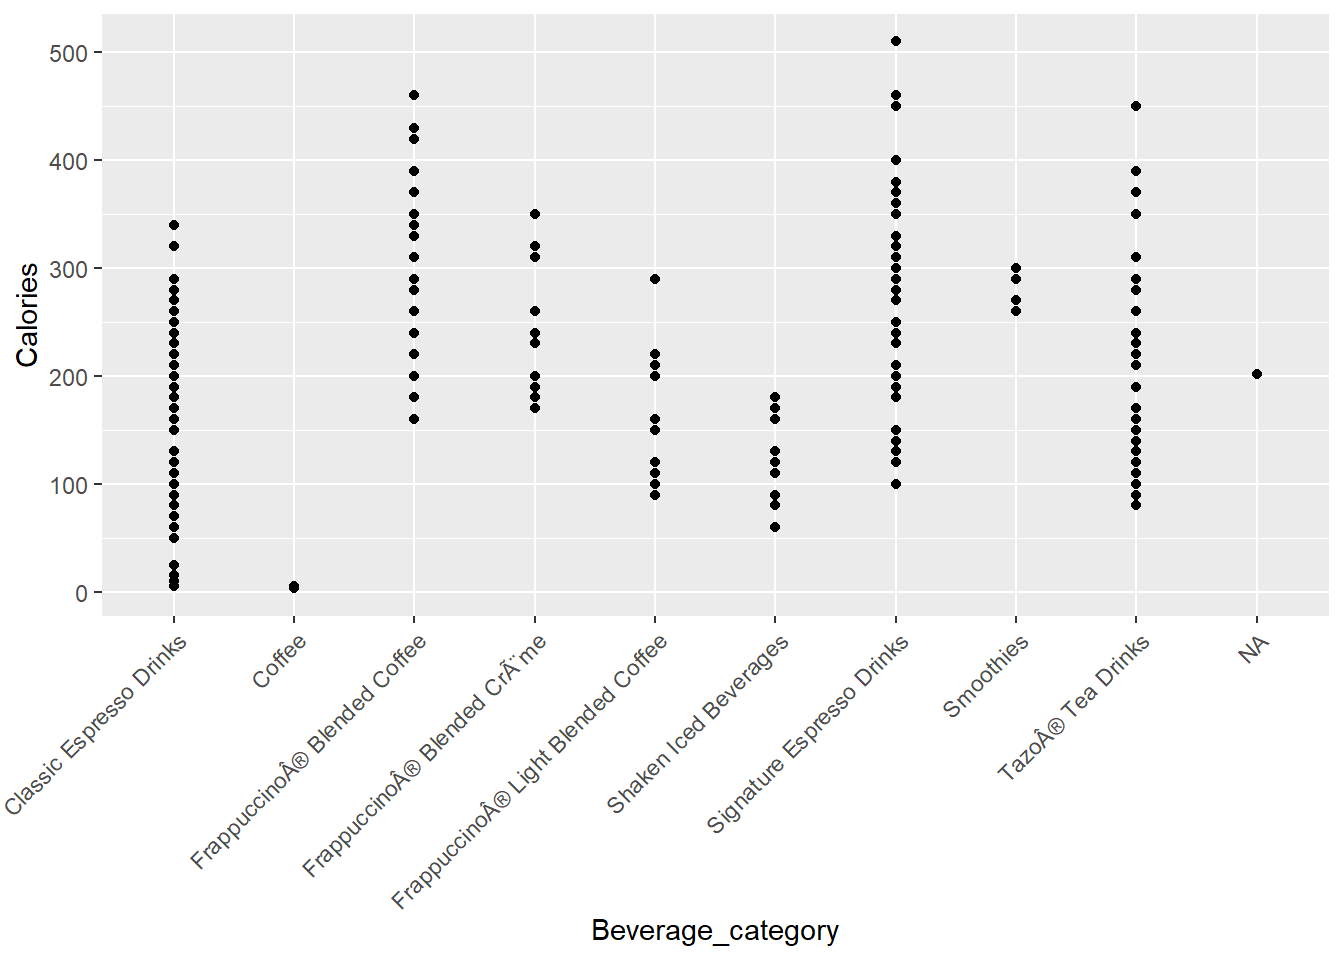
As we can see, The signature espreso drinks as well as the frappuchino drinks have the most calories. It is obvious as they put a lot of sugar and milk into such drinks. The highest is about 510 calories and that goes to the espresso mocha.
#Caloriestop_cals<-top_n(starbuck,7,Calories)top_cals## # A tibble: 7 × 14
## Beverage_category Beverage Beverage_prep Calories `Total Fat (g)`
## <chr> <chr> <chr> <dbl> <dbl>
## 1 Signature Espresso Drinks White Cho… Venti Nonfat… 450 7
## 2 Signature Espresso Drinks White Cho… 2% Milk 510 15
## 3 Signature Espresso Drinks White Cho… Soymilk 460 13
## 4 Tazo® Tea Drinks Tazo® Gr… 2% Milk 450 10
## 5 Frappuccino® Blended Coffee Java Chip… Venti Nonfat… 420 5
## 6 Frappuccino® Blended Coffee Java Chip… Whole Milk 460 10
## 7 Frappuccino® Blended Coffee Java Chip… Soymilk 430 8
## # ℹ 9 more variables: `Trans Fat (g)` <dbl>, `Saturated Fat (g)` <dbl>,
## # `Sodium (mg)` <dbl>, `Total Carbohydrates (g)` <dbl>,
## # `Cholesterol (mg)` <dbl>, `Dietary Fibre (g)` <dbl>, `Sugars (g)` <dbl>,
## # `Protein (g)` <dbl>, `Caffeine (mg)` <dbl>
top_cals$Calories## [1] 450 510 460 450 420 460 430
Caffeine
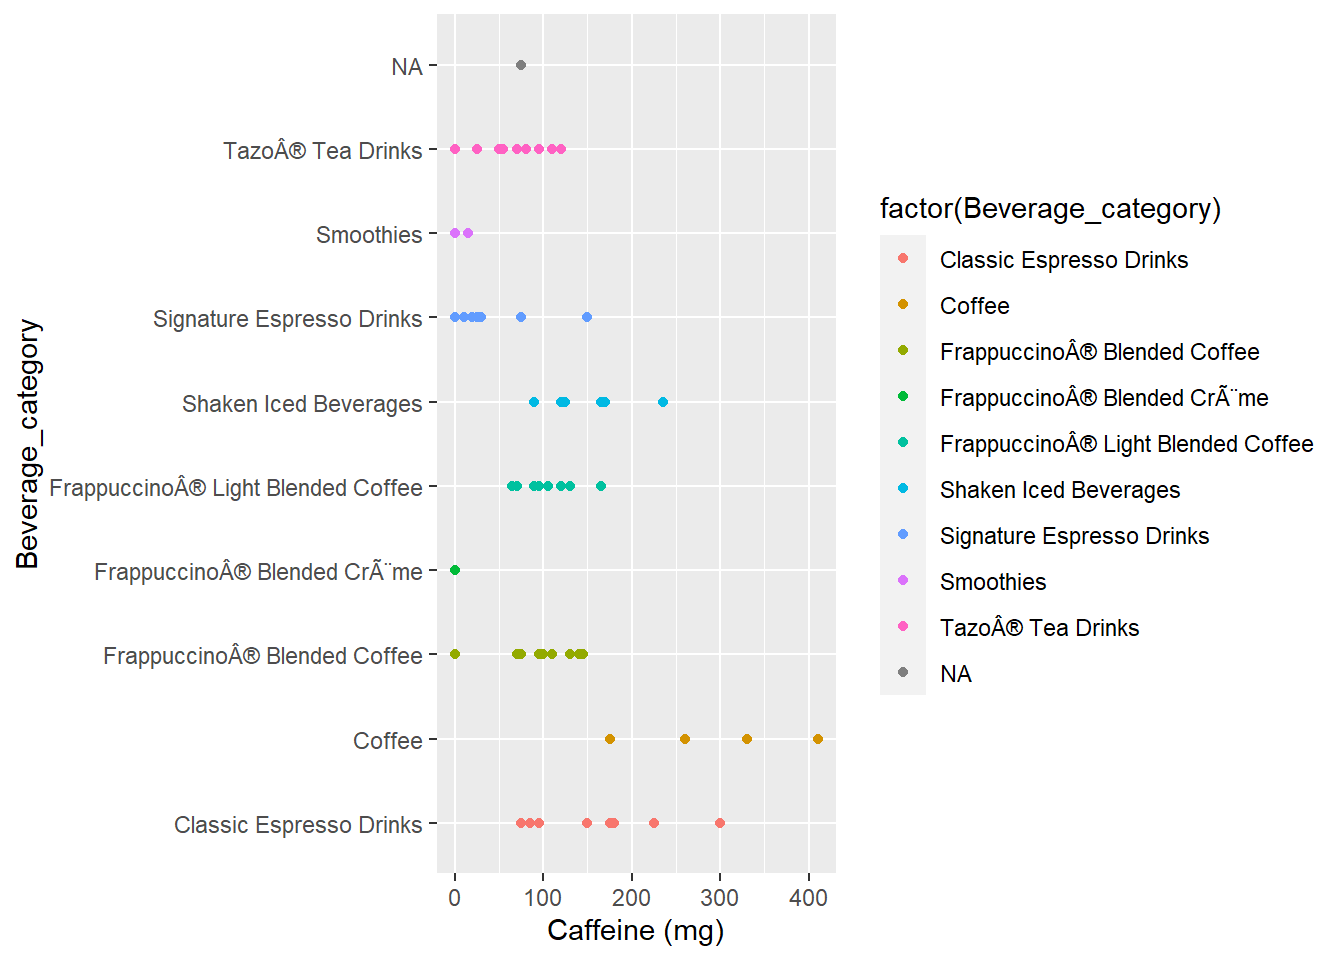
The regular coffee drinks (brewed coffee and/or espresso shot drinks) are the ones that have the most caffeine where 410 is the highest amount of caffeine out of any drink at starbucks.
top_caff <- starbuck %>% top_n(5, `Caffeine (mg)`)
top_caff
## # A tibble: 5 × 14
##   Beverage_category       Beverage        Beverage_prep Calories `Total Fat (g)`
##   <chr>                   <chr>           <chr>            <dbl>           <dbl>
## 1 Coffee                  Brewed Coffee   Tall                 4             0.1
## 2 Coffee                  Brewed Coffee   Grande               5             0.1
## 3 Coffee                  Brewed Coffee   Venti                5             0.1
## 4 Classic Espresso Drinks Caffè America… Venti               25             0
## 5 Shaken Iced Beverages   Iced Brewed Co… Venti              130             0.1
## # ℹ 9 more variables: `Trans Fat (g)` <dbl>, `Saturated Fat (g)` <dbl>,
## #   `Sodium (mg)` <dbl>, `Total Carbohydrates (g)` <dbl>,
## #   `Cholesterol (mg)` <dbl>, `Dietary Fibre (g)` <dbl>, `Sugars (g)` <dbl>,
## #   `Protein (g)` <dbl>, `Caffeine (mg)` <dbl>
top_caff$`Caffeine (mg)`
## [1] 260 330 410 300 235
Sugar
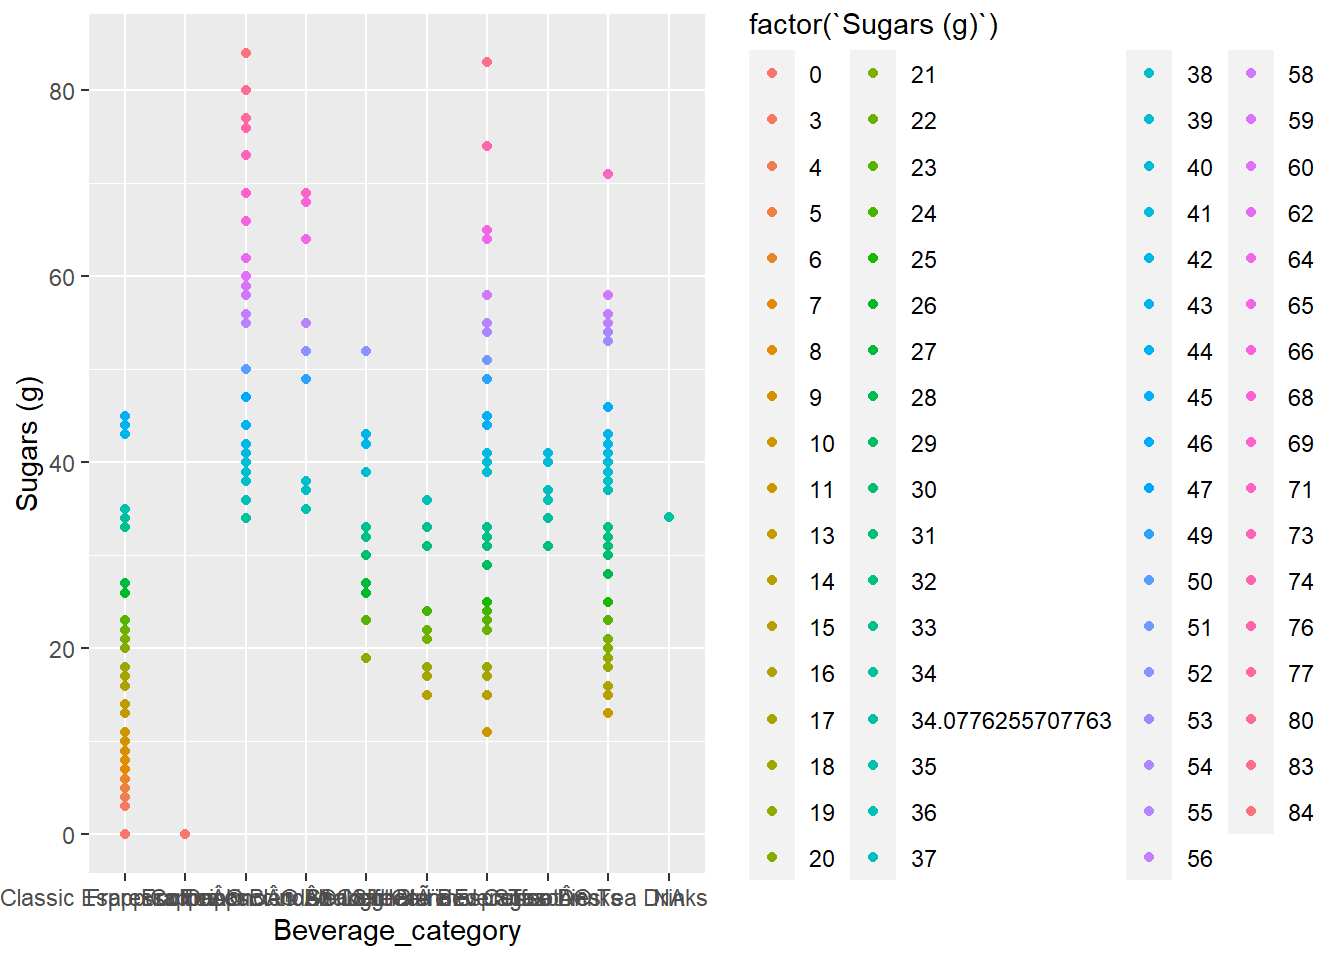
Similar to Calories, the obvious frappuccino and espresso drinks have the most sugar with the caramel frappuccino having the most sugar (about 77 to 80 grams)
top_sug<-top_n(starbuck,5,`Sugars (g)`)
top_sug
## # A tibble: 6 × 14
##   Beverage_category            Beverage   Beverage_prep Calories `Total Fat (g)`
##   <chr>                        <chr>      <chr>            <dbl>           <dbl>
## 1 Signature Espresso Drinks    Caramel A… Venti              360             0
## 2 Frappuccino® Blended Coffee Caramel (… Venti Nonfat…      330             0.1
## 3 Frappuccino® Blended Coffee Caramel (… Whole Milk         370             5
## 4 Frappuccino® Blended Coffee Java Chip… Venti Nonfat…      420             5
## 5 Frappuccino® Blended Coffee Java Chip… Whole Milk         460            10
## 6 Frappuccino® Blended Coffee Java Chip… Soymilk            430             8
## # ℹ 9 more variables: `Trans Fat (g)` <dbl>, `Saturated Fat (g)` <dbl>,
## #   `Sodium (mg)` <dbl>, `Total Carbohydrates (g)` <dbl>,
## #   `Cholesterol (mg)` <dbl>, `Dietary Fibre (g)` <dbl>, `Sugars (g)` <dbl>,
## #   `Protein (g)` <dbl>, `Caffeine (mg)` <dbl>
top_sug$`Sugars (g)`
## [1] 83 77 77 84 84 80
GGPLOTS
##  [1] "Coffee"                             "Classic Espresso Drinks"
##  [3] "Signature Espresso Drinks"          "Tazo® Tea Drinks"
##  [5] "Shaken Iced Beverages"              NA
##  [7] "Smoothies"                          "Frappuccino® Blended Coffee"
##  [9] "Frappuccino® Light Blended Coffee" "Frappuccino® Blended Crème"
Implementing a decision tree
#Implementing a decision tree#Split data into 80 training and 20 testingset.seed(333333)sample <- sample(c(TRUE, FALSE), nrow(starbuck), replace=TRUE, prob=c(0.8,0.2))train<- starbuck[sample,]test<- starbuck[!sample,]#Fitting the full regression with RSS splittinglibrary(rpart)regression_tree<- rpart(Calories~`Trans Fat (g)`+Beverage_category +Beverage_prep+`Total Fat (g)`+`Trans Fat (g)`+`Saturated Fat (g)` + `Sodium (mg)`+`Total Carbohydrates (g)`+`Cholesterol (mg)` +`Dietary Fibre (g)`+`Sugars (g)`+`Protein (g)` +`Caffeine (mg)`, data=train, method="anova", xval=10, cp=0) #xval=number of cross-validationsprintcp(regression_tree)##
## Regression tree:
## rpart(formula = Calories ~ `Trans Fat (g)` + Beverage_category +
## Beverage_prep + `Total Fat (g)` + `Trans Fat (g)` + `Saturated Fat (g)` +
## `Sodium (mg)` + `Total Carbohydrates (g)` + `Cholesterol (mg)` +
## `Dietary Fibre (g)` + `Sugars (g)` + `Protein (g)` + `Caffeine (mg)`,
## data = train, method = "anova", xval = 10, cp = 0)
##
## Variables actually used in tree construction:
## [1] Cholesterol (mg) Protein (g) Total Fat (g) Trans Fat (g)
##
## Root node error: 1921594/180 = 10676
##
## n= 180
##
## CP nsplit rel error xerror xstd
## 1 0.5954684 0 1.000000 1.00909 0.103525
## 2 0.1189639 1 0.404532 0.42958 0.045698
## 3 0.0980527 2 0.285568 0.32016 0.041311
## 4 0.0355660 3 0.187515 0.22911 0.025358
## 5 0.0331526 4 0.151949 0.20916 0.025635
## 6 0.0209616 5 0.118796 0.17739 0.021411
## 7 0.0166832 6 0.097835 0.15701 0.019080
## 8 0.0081391 7 0.081152 0.14347 0.018135
## 9 0.0077335 8 0.073012 0.14351 0.017251
## 10 0.0052884 9 0.065279 0.13448 0.016054
## 11 0.0038764 10 0.059990 0.12324 0.015786
## 12 0.0027848 11 0.056114 0.11667 0.015735
## 13 0.0000000 12 0.053329 0.11082 0.015583
#Fitting the regression tree with rss splitting and cost-complexity pruningreg.tree.rss<-rpart(Calories~`Trans Fat (g)`+Beverage_category +Beverage_prep+`Total Fat (g)`+`Trans Fat (g)`+`Saturated Fat (g)` + `Sodium (mg)`+`Total Carbohydrates (g)`+`Cholesterol (mg)` +`Dietary Fibre (g)`+`Sugars (g)`+`Protein (g)` +`Caffeine (mg)`, data=train, method="anova", cp=0.026) #xval=number of cross-validationsrpart.plot(reg.tree.rss, type=2)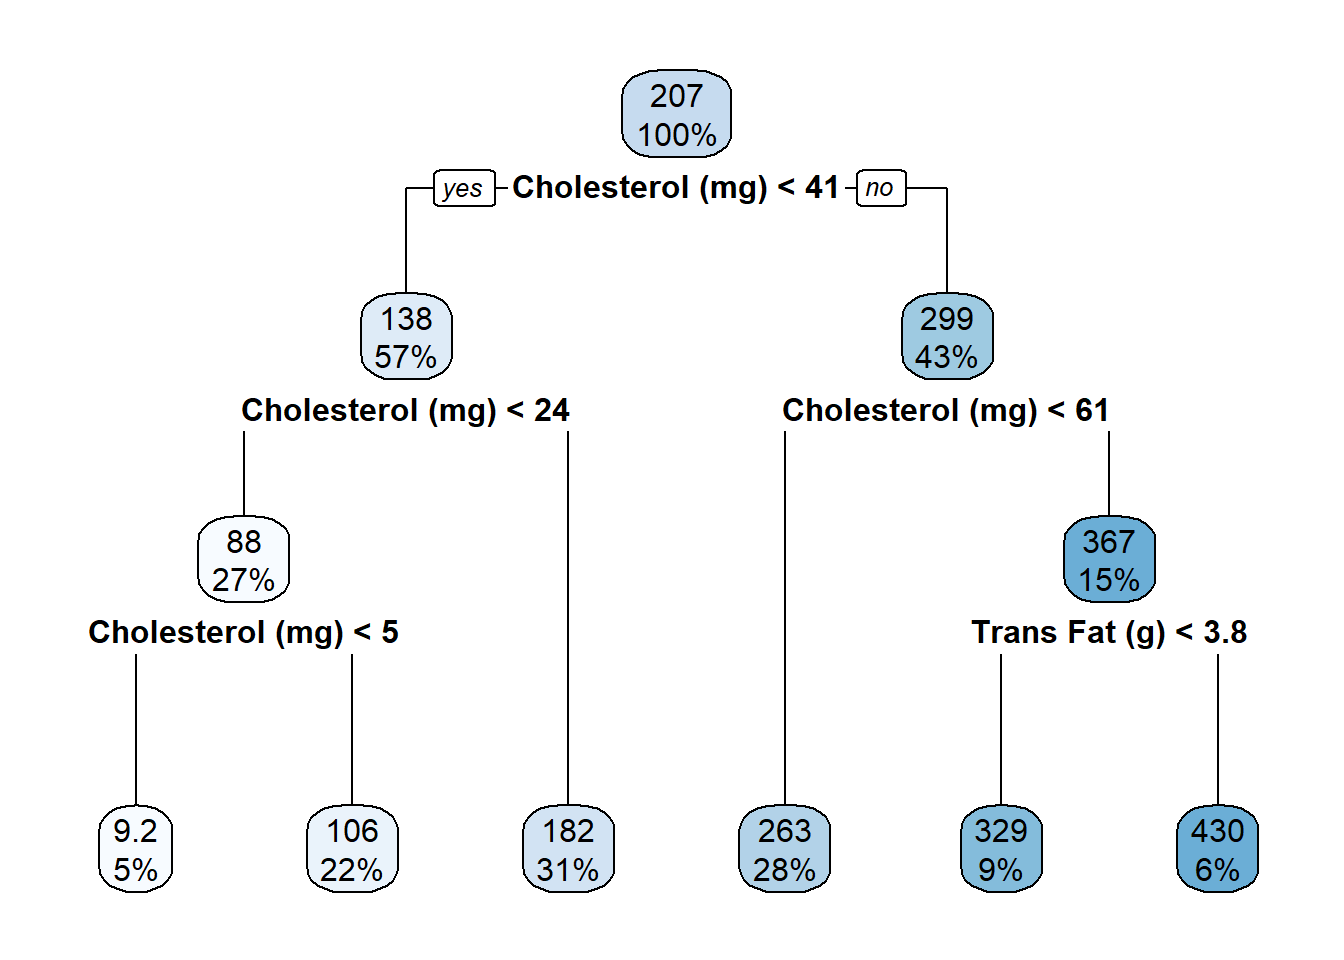
plotcp(reg.tree.rss)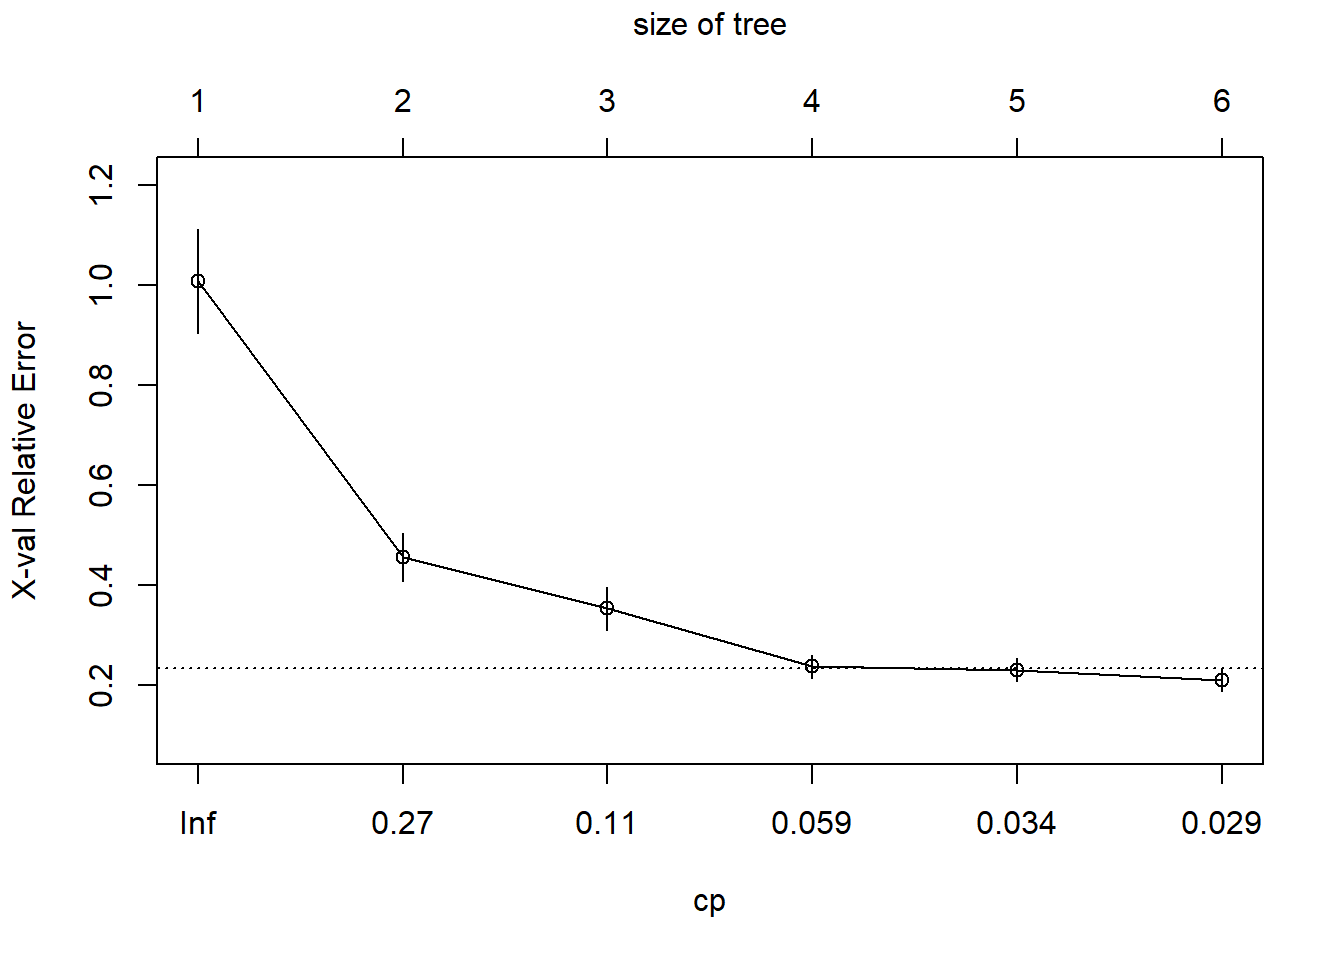
p <- predict(reg.tree.rss, train)sqrt(mean((train$Calories-p)^2))## [1] 35.61198
(cor(train$Calories,p))^2 #Not bad## [1] 0.8812036
Computing prediction accuracy for testing data
calories_value<-predict(reg.tree.rss,newdata=test)#Accuracy within 10%accuracy10<-ifelse(abs(test$Calories-calories_value)<0.10*test$Calories,1,0)print(mean(accuracy10))## [1] 0.4
#Accuracy within 15%accuracy15<-ifelse(abs(test$Calories-calories_value)<0.15*test$Calories,1,0)print(mean(accuracy15))## [1] 0.45
#Accuracy within 20%accuracy20<-ifelse(abs(test$Calories-calories_value)<0.20*test$Calories,1,0)print(mean(accuracy20))## [1] 0.575
Prediction of Calorie content: let's create a model that predicts the calories of the beverages based on the nutritional attributes
testing.lm.no.bev.category<-lm(Calories~ `Trans Fat (g)` +`Total Fat (g)`+`Trans Fat (g)`+`Saturated Fat (g)` + `Sodium (mg)`+`Total Carbohydrates (g)`+`Cholesterol (mg)` +`Dietary Fibre (g)`+`Sugars (g)`+`Protein (g)` +`Caffeine (mg)`,data=starbuck)summary(testing.lm.no.bev.category)##
## Call:
## lm(formula = Calories ~ `Trans Fat (g)` + `Total Fat (g)` + `Trans Fat (g)` +
## `Saturated Fat (g)` + `Sodium (mg)` + `Total Carbohydrates (g)` +
## `Cholesterol (mg)` + `Dietary Fibre (g)` + `Sugars (g)` +
## `Protein (g)` + `Caffeine (mg)`, data = starbuck)
##
## Residuals:
## Min 1Q Median 3Q Max
## -19.4205 -3.1591 0.1326 3.9047 22.2421
##
## Coefficients:
## Estimate Std. Error t value Pr(>|t|)
## (Intercept) 0.652942 1.380978 0.473 0.637
## `Trans Fat (g)` -4.010404 0.802342 -4.998 1.22e-06 ***
## `Total Fat (g)` 10.701136 0.424421 25.214 < 2e-16 ***
## `Saturated Fat (g)` -17.564298 24.375484 -0.721 0.472
## `Sodium (mg)` 0.084362 0.226174 0.373 0.710
## `Total Carbohydrates (g)` 0.002590 0.010354 0.250 0.803
## `Cholesterol (mg)` 1.459109 0.359711 4.056 7.04e-05 ***
## `Dietary Fibre (g)` 1.047705 0.905380 1.157 0.249
## `Sugars (g)` 2.556707 0.365633 6.993 3.58e-11 ***
## `Protein (g)` 4.125523 0.214781 19.208 < 2e-16 ***
## `Caffeine (mg)` 0.009717 0.007750 1.254 0.211
## ---
## Signif. codes: 0 '***' 0.001 '**' 0.01 '*' 0.05 '.' 0.1 ' ' 1
##
## Residual standard error: 6.822 on 209 degrees of freedom
## Multiple R-squared: 0.9957, Adjusted R-squared: 0.9955
## F-statistic: 4886 on 10 and 209 DF, p-value: < 2.2e-16
testing.lm.all.variables<-lm(Calories~.,data=starbuck)
summary(testing.lm.all.variables)
##
## Call:
## lm(formula = Calories ~ ., data = starbuck)
##
## Residuals:
##     Min      1Q  Median      3Q     Max
## -8.4677 -2.5853 -0.1322  3.0578 22.3296
##
## Coefficients: (9 not defined because of singularities)
##                                                            Estimate Std. Error
## (Intercept)                                                6.567237   2.497415
## Beverage_categoryCoffee                                  -14.469504   7.230937
## Beverage_categoryFrappuccino® Blended Coffee            -14.103063   3.638734
## Beverage_categoryFrappuccino® Blended Crème             -4.066706   3.895391
## Beverage_categoryFrappuccino® Light Blended Coffee      -12.709313   5.011721
## Beverage_categoryShaken Iced Beverages                   -11.515929   8.290322
## Beverage_categorySignature Espresso Drinks                -2.562555   3.680371
## Beverage_categorySmoothies                                16.886041  10.567195
## Beverage_categoryTazo® Tea Drinks                         0.699914   2.559716
## BeverageBrewed Coffee                                            NA         NA
## BeverageCaffè Americano                                  -4.650283   5.856240
## BeverageCaffè Latte                                       2.421215   2.516571
## BeverageCaffè Mocha (Without Whipped Cream)             -13.014020   3.180541
## BeverageCappuccino                                        -2.484173   2.165157
## BeverageCaramel                                            5.878569   4.486360
## BeverageCaramel (Without Whipped Cream)                    5.520258   2.454053
## BeverageCaramel Apple Spice (Without Whipped Cream)        3.381636   8.307537
## BeverageCaramel Macchiato                                  2.629817   3.391630
## BeverageCoffee                                             6.409524   2.541778
## BeverageEspresso                                          -7.016961   5.244654
## BeverageHot Chocolate (Without Whipped Cream)            -11.422214   4.153804
## BeverageIced Brewed Coffee (With Classic Syrup)            0.566131   5.639929
## BeverageIced Brewed Coffee (With Milk & Classic Syrup)     1.389709   6.838224
## BeverageJava Chip                                          1.071650   4.817180
## BeverageJava Chip (Without Whipped Cream)                  0.393592   3.166319
## BeverageMocha                                              4.202803   4.321297
## BeverageMocha (Without Whipped Cream)                            NA         NA
## BeverageOrange Mango Banana Smoothie                       3.990424   4.528928
## BeverageShaken Iced Tazo® Tea (With Classic Syrup)              NA         NA
## BeverageSkinny Latte (Any Flavour)                         1.883665   3.326735
## BeverageStrawberries & Crème (Without Whipped Cream)     -1.085203   2.835004
## BeverageStrawberry Banana Smoothie                         6.119981   4.573143
## BeverageTazo® Chai Tea Latte                             -6.954146   2.892406
## BeverageTazo® Full-Leaf Red Tea Latte (Vanilla Rooibos)  -2.997075   2.359801
## BeverageTazo® Green Tea Latte                                   NA         NA
## BeverageVanilla Bean (Without Whipped Cream)                     NA         NA
## BeverageVanilla Latte (Or Other Flavoured Latte)                 NA         NA
## BeverageWhite Chocolate Mocha (Without Whipped Cream)            NA         NA
## Beverage_prepDoppio                                       -1.122542   6.563212
## Beverage_prepGrande                                       -1.160197   3.475251
## Beverage_prepGrande Nonfat Milk                            1.128095   2.469494
## Beverage_prepShort                                        -1.537238   4.934492
## Beverage_prepShort Nonfat Milk                            -1.779256   2.275787
## Beverage_prepSolo                                                NA         NA
## Beverage_prepSoymilk                                      -0.250029   2.063162
## Beverage_prepTall                                         -2.050423   3.984348
## Beverage_prepTall Nonfat Milk                             -0.134932   2.334350
## Beverage_prepVenti                                               NA         NA
## Beverage_prepVenti Nonfat Milk                             3.114194   2.975403
## Beverage_prepWhole Milk                                    0.992856   1.848747
## `Total Fat (g)`                                           11.126722   0.655794
## `Trans Fat (g)`                                           -2.405652   1.257778
## `Saturated Fat (g)`                                       -8.197054  19.757156
## `Sodium (mg)`                                             -0.240048   0.197710
## `Total Carbohydrates (g)`                                 -0.008307   0.027808
## `Cholesterol (mg)`                                         1.555906   0.527579
## `Dietary Fibre (g)`                                       -0.322717   1.226310
## `Sugars (g)`                                               2.528153   0.538311
## `Protein (g)`                                              3.405624   0.328485
## `Caffeine (mg)`                                            0.033754   0.017445
##                                                          t value Pr(>|t|)
## (Intercept)                                                2.630 0.009342 **
## Beverage_categoryCoffee                                   -2.001 0.046997 *
## Beverage_categoryFrappuccino® Blended Coffee             -3.876 0.000152 ***
## Beverage_categoryFrappuccino® Blended Crème             -1.044 0.297995
## Beverage_categoryFrappuccino® Light Blended Coffee       -2.536 0.012127 *
## Beverage_categoryShaken Iced Beverages                    -1.389 0.166647
## Beverage_categorySignature Espresso Drinks                -0.696 0.487218
## Beverage_categorySmoothies                                 1.598 0.111929
## Beverage_categoryTazo® Tea Drinks                         0.273 0.784855
## BeverageBrewed Coffee                                         NA       NA
## BeverageCaffè Americano                                  -0.794 0.428273
## BeverageCaffè Latte                                       0.962 0.337378
## BeverageCaffè Mocha (Without Whipped Cream)              -4.092 6.63e-05 ***
## BeverageCappuccino                                        -1.147 0.252872
## BeverageCaramel                                            1.310 0.191876
## BeverageCaramel (Without Whipped Cream)                    2.249 0.025783 *
## BeverageCaramel Apple Spice (Without Whipped Cream)        0.407 0.684485
## BeverageCaramel Macchiato                                  0.775 0.439202
## BeverageCoffee                                             2.522 0.012611 *
## BeverageEspresso                                          -1.338 0.182729
## BeverageHot Chocolate (Without Whipped Cream)             -2.750 0.006616 **
## BeverageIced Brewed Coffee (With Classic Syrup)            0.100 0.920163
## BeverageIced Brewed Coffee (With Milk & Classic Syrup)     0.203 0.839204
## BeverageJava Chip                                          0.222 0.824223
## BeverageJava Chip (Without Whipped Cream)                  0.124 0.901222
## BeverageMocha                                              0.973 0.332161
## BeverageMocha (Without Whipped Cream)                         NA       NA
## BeverageOrange Mango Banana Smoothie                       0.881 0.379524
## BeverageShaken Iced Tazo® Tea (With Classic Syrup)           NA       NA
## BeverageSkinny Latte (Any Flavour)                         0.566 0.572000
## BeverageStrawberries & Crème (Without Whipped Cream)     -0.383 0.702361
## BeverageStrawberry Banana Smoothie                         1.338 0.182625
## BeverageTazo® Chai Tea Latte                             -2.404 0.017292 *
## BeverageTazo® Full-Leaf Red Tea Latte (Vanilla Rooibos)  -1.270 0.205821
## BeverageTazo® Green Tea Latte                                NA       NA
## BeverageVanilla Bean (Without Whipped Cream)                  NA       NA
## BeverageVanilla Latte (Or Other Flavoured Latte)              NA       NA
## BeverageWhite Chocolate Mocha (Without Whipped Cream)         NA       NA
## Beverage_prepDoppio                                       -0.171 0.864402
## Beverage_prepGrande                                       -0.334 0.738912
## Beverage_prepGrande Nonfat Milk                            0.457 0.648396
## Beverage_prepShort                                        -0.312 0.755785
## Beverage_prepShort Nonfat Milk                            -0.782 0.435421
## Beverage_prepSolo                                             NA       NA
## Beverage_prepSoymilk                                      -0.121 0.903688
## Beverage_prepTall                                         -0.515 0.607495
## Beverage_prepTall Nonfat Milk                             -0.058 0.953974
## Beverage_prepVenti                                            NA       NA
## Beverage_prepVenti Nonfat Milk                             1.047 0.296766
## Beverage_prepWhole Milk                                    0.537 0.591949
## `Total Fat (g)`                                           16.967  < 2e-16 ***
## `Trans Fat (g)`                                           -1.913 0.057498 .
## `Saturated Fat (g)`                                       -0.415 0.678751
## `Sodium (mg)`                                             -1.214 0.226397
## `Total Carbohydrates (g)`                                 -0.299 0.765514
## `Cholesterol (mg)`                                         2.949 0.003641 **
## `Dietary Fibre (g)`                                       -0.263 0.792749
## `Sugars (g)`                                               4.696 5.48e-06 ***
## `Protein (g)`                                             10.368  < 2e-16 ***
## `Caffeine (mg)`                                            1.935 0.054682 .
## ---
## Signif. codes:  0 '***' 0.001 '**' 0.01 '*' 0.05 '.' 0.1 ' ' 1
##
## Residual standard error: 4.553 on 168 degrees of freedom
##   (1 observation deleted due to missingness)
## Multiple R-squared:  0.9985, Adjusted R-squared:  0.998
## F-statistic:  2200 on 50 and 168 DF,  p-value: < 2.2e-16
Is there a correlation between size of beverage and its nutritional values, such as calorie of sugar?
library(ggcorrplot)
## Warning: package 'ggcorrplot' was built under R version 4.3.2
corr_data=cor(starbuck[, c('Calories','Saturated Fat (g)','Sugars (g)','Caffeine (mg)', 'Total Fat (g)','Sodium (mg)','Total Carbohydrates (g)','Protein (g)')])ggcorrplot(corr_data)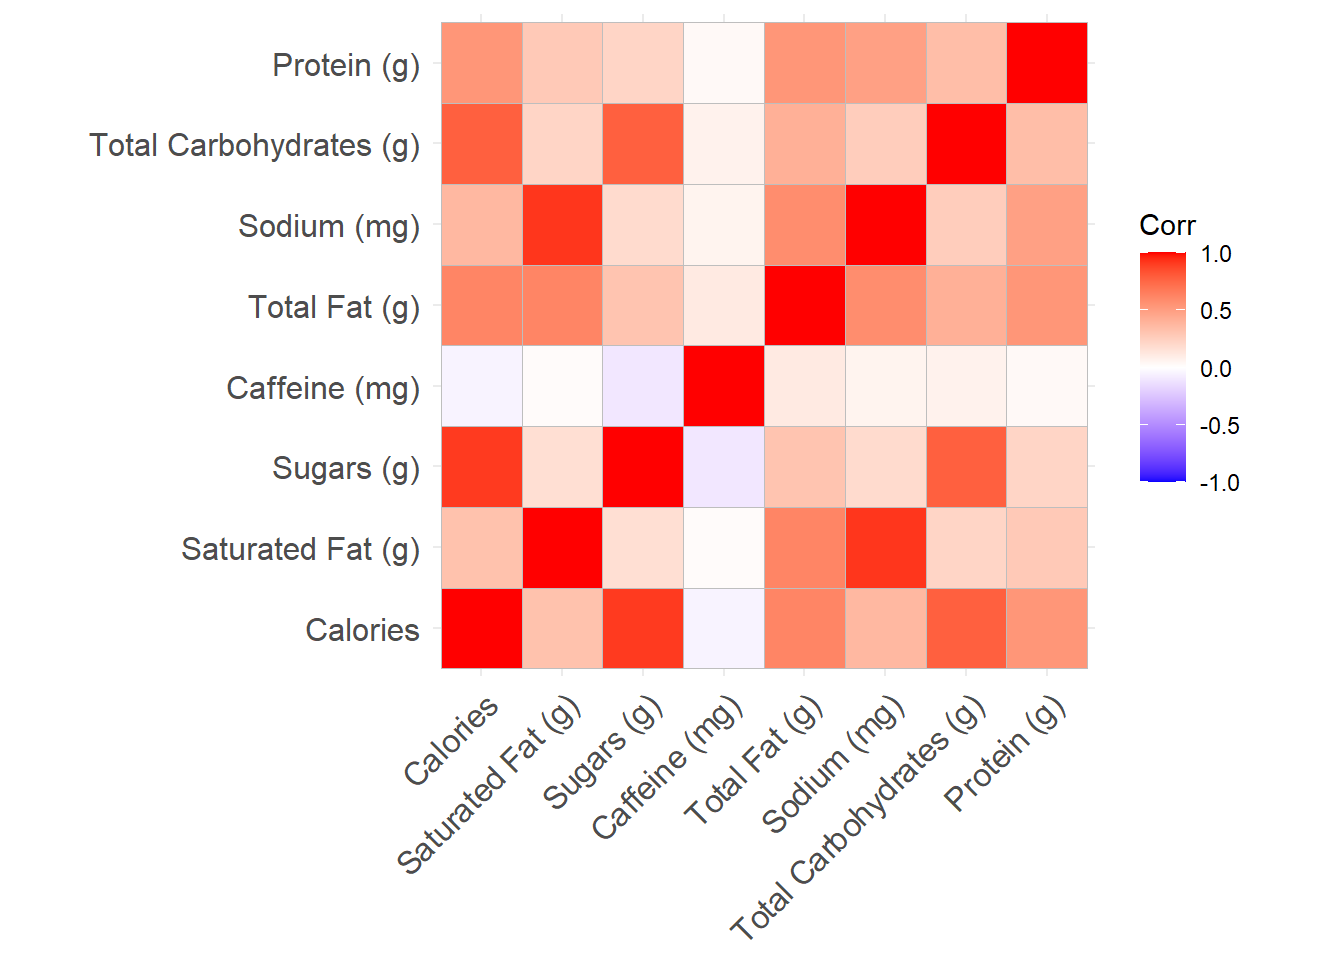
# Argument colorsggcorrplot(corr_data, hc.order = TRUE, type = "lower", outline.col = "white", ggtheme = ggplot2::theme_gray, colors = c("#6D9EC1", "white", "#E46726"))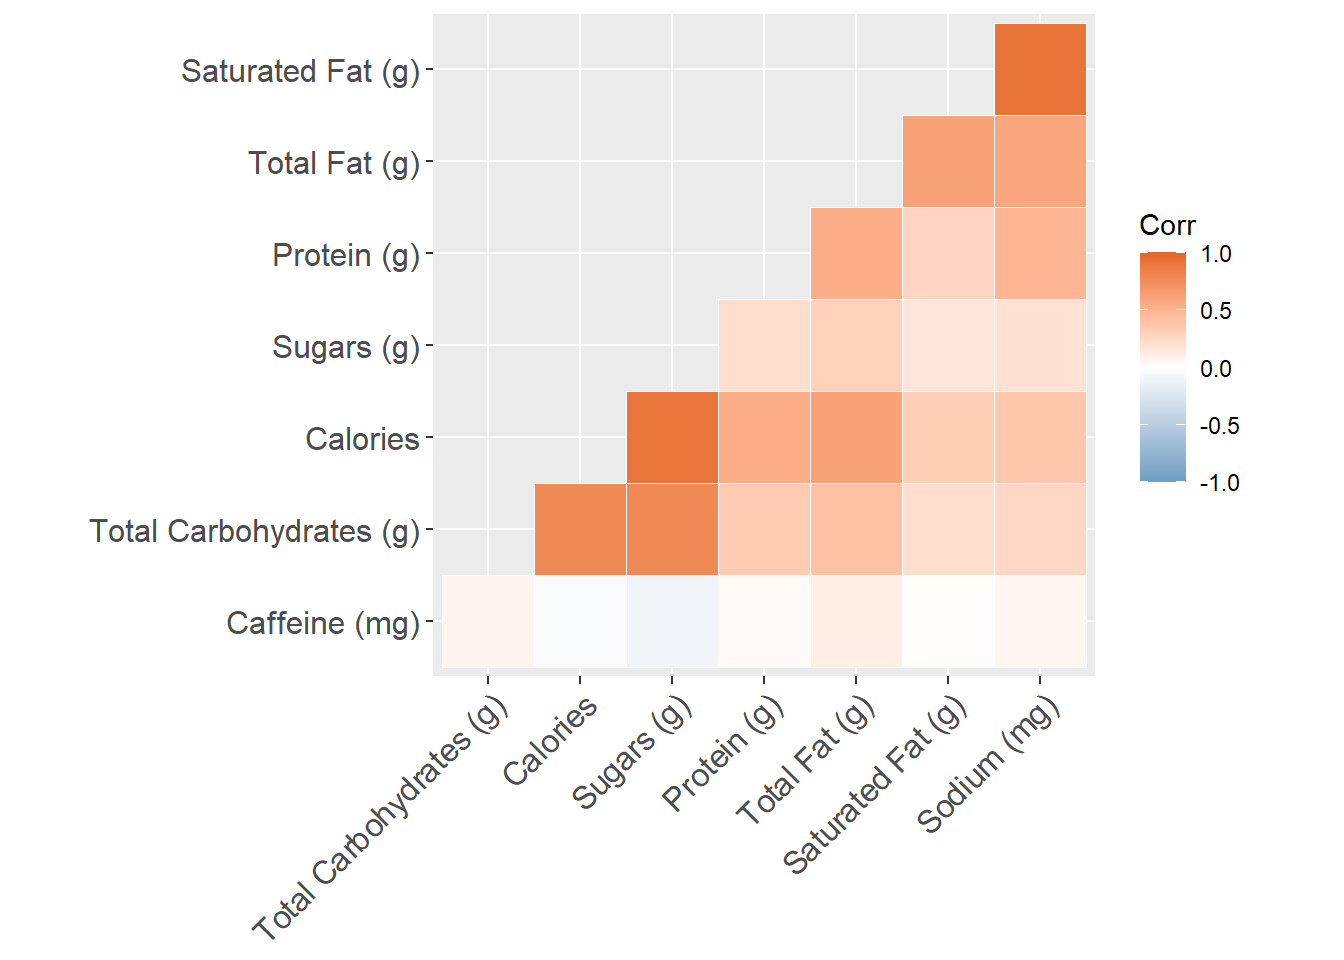
Classifying if a drink is healthy or not
Note: This is somewhat subjective depending on the person but for my case
I would say a drink is unhealthy if it has over 200 calories or over 25 gram of sugar
#1 is healthy and 0 is unhealthy, for referencestarbuck$healthy <- ifelse(starbuck$Calories>200 | starbuck$`Sugars (g)`>25, 0, 1)head(starbuck)## # A tibble: 6 × 15
## Beverage_category Beverage Beverage_prep Calories `Total Fat (g)`
## <chr> <chr> <chr> <dbl> <dbl>
## 1 Coffee Brewed Coffee Short 3 0.1
## 2 Coffee Brewed Coffee Tall 4 0.1
## 3 Coffee Brewed Coffee Grande 5 0.1
## 4 Coffee Brewed Coffee Venti 5 0.1
## 5 Classic Espresso Drinks Caffè Latte Short Nonfat M… 70 0.1
## 6 Classic Espresso Drinks Caffè Latte 2% Milk 100 3.5
## # ℹ 10 more variables: `Trans Fat (g)` <dbl>, `Saturated Fat (g)` <dbl>,
## # `Sodium (mg)` <dbl>, `Total Carbohydrates (g)` <dbl>,
## # `Cholesterol (mg)` <dbl>, `Dietary Fibre (g)` <dbl>, `Sugars (g)` <dbl>,
## # `Protein (g)` <dbl>, `Caffeine (mg)` <dbl>, healthy <dbl>
#From the linear regression output, the very 5 significant predictors were#Trans fat, total fat, cholesterol, sugars, and protein so we will analyze#its distribution as a continous independent variable with respect to healthy#or not healthyComparing the box and whisker distribution of Healthy and unhealthy patients on the 5 important predictors
par(mfrow = c(3,2))boxplot(`Total Fat (g)`~healthy, ylab="Total Fat (g)", xlab= "Healthy", col="light blue",data = starbuck)boxplot(`Trans Fat (g)`~healthy, ylab="Trans Fat (g)", xlab= "Healthy", col="light blue",data = starbuck)boxplot(`Cholesterol (mg)`~healthy, ylab="Cholesterol (mg)", xlab= "Healthy", col="light blue",data = starbuck)boxplot(`Sugars (g)`~healthy, ylab="Sugars (g)", xlab= "Healthy", col="light blue",data = starbuck)boxplot(`Protein (g)`~healthy, ylab="Protein (g)", xlab= "Healthy", col="light blue",data = starbuck)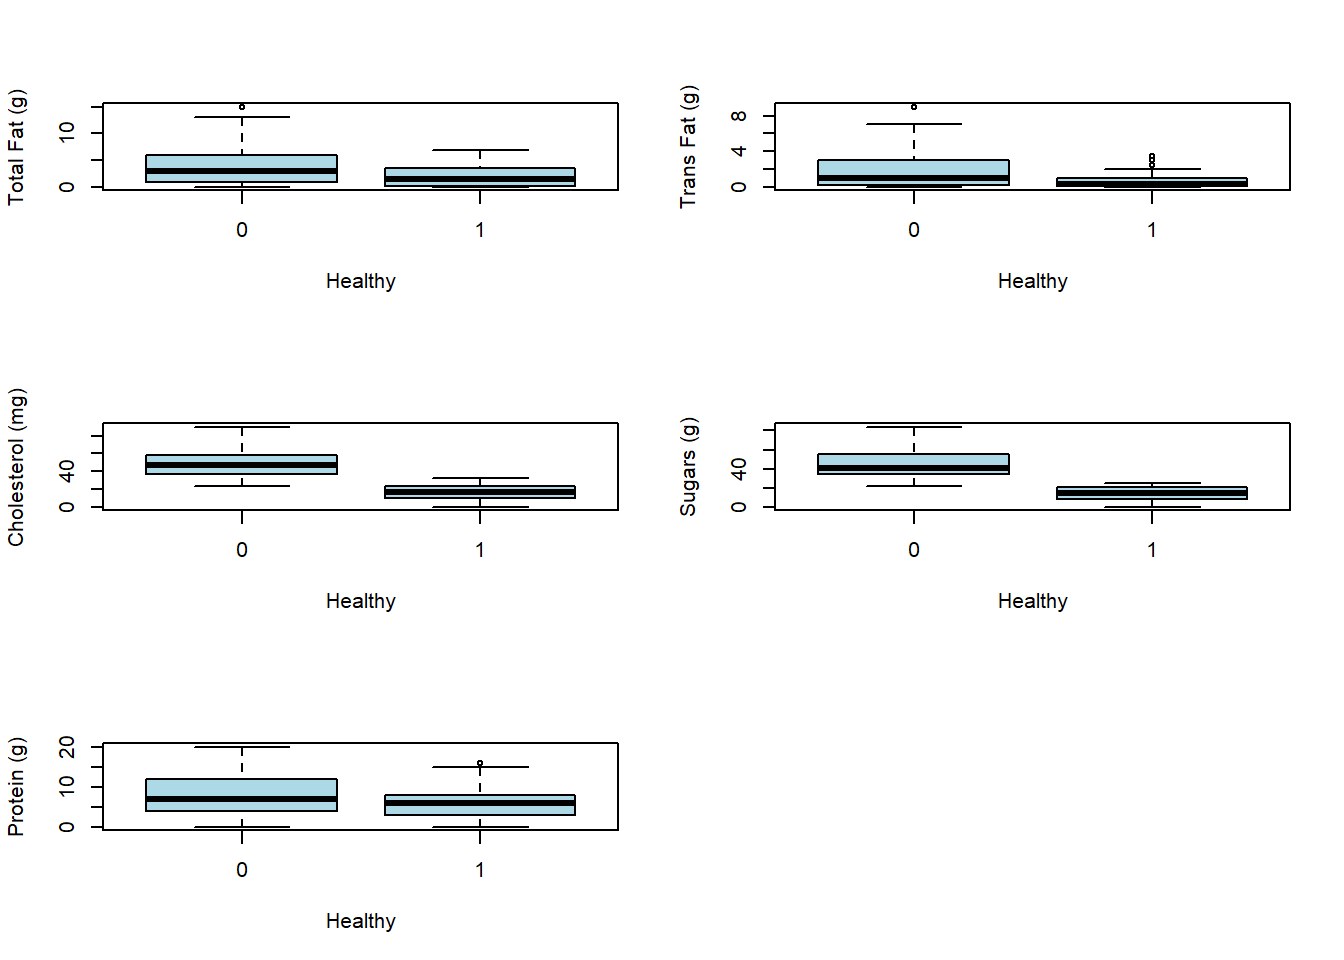
#SPLITTING DATA INTO 80% TRAINING AND 20% TESTING SETSlibrary(tidyverse)library(keras)library(xgboost)set.seed(5464654)indexing <- sample(c(TRUE, FALSE), nrow(starbuck), replace=TRUE, prob=c(0.8,0.2))training<- starbuck[indexing,]testing<- starbuck[!indexing,]#Delete the non-numeric columnstraining <- training[, -(1:3)]testing<-testing[, -(1:3)]healthy1<-nrow(training)healthy2<-nrow(testing)X_train<-training[, -ncol(training)]y_train<-training[,ncol(training)]X_test<-testing[, -ncol(testing)]y_test<-testing[,ncol(testing)]#Converting x and y train/test to matrix to satisfy xgboost algorithmX_train<-as.matrix(X_train)y_train<-as.matrix(y_train)X_test<-as.matrix(X_test)y_test<-as.matrix(y_test)# X_train <- training %>%# select(-healthy) %>%# scale()# #Convert the training$healthy to factor# factor_vector_train <- factor(training$healthy)# y_train <- factor_vector_train## #Performing a transformation on the test set and test set labels# X_test <- testing %>%# select(-healthy) %>%# scale()# factor_vector_test <- factor(testing$healthy)# y_test <- factor_vector_test#FITTING EXTREME GRADIENT BOOSTED REGRESSION TREExgb.reg<- xgboost(data=X_train, label=y_train, max.depth=6, eta=0.01, subsample=0.8, colsample_bytree=0.5, nrounds=100, objective="reg:linear")## [17:41:38] WARNING: src/objective/regression_obj.cu:213: reg:linear is now deprecated in favor of reg:squarederror.
## [1] train-rmse:0.495336
## [2] train-rmse:0.490467
## [3] train-rmse:0.485648
## [4] train-rmse:0.482478
## [5] train-rmse:0.477739
## [6] train-rmse:0.473092
## [7] train-rmse:0.468727
## [8] train-rmse:0.464408
## [9] train-rmse:0.459848
## [10] train-rmse:0.455860
## [11] train-rmse:0.451677
## [12] train-rmse:0.447553
## [13] train-rmse:0.444567
## [14] train-rmse:0.440405
## [15] train-rmse:0.436079
## [16] train-rmse:0.431799
## [17] train-rmse:0.427603
## [18] train-rmse:0.423615
## [19] train-rmse:0.419461
## [20] train-rmse:0.415383
## [21] train-rmse:0.413481
## [22] train-rmse:0.409678
## [23] train-rmse:0.407962
## [24] train-rmse:0.403957
## [25] train-rmse:0.401357
## [26] train-rmse:0.397655
## [27] train-rmse:0.393758
## [28] train-rmse:0.389896
## [29] train-rmse:0.386110
## [30] train-rmse:0.382319
## [31] train-rmse:0.378574
## [32] train-rmse:0.374852
## [33] train-rmse:0.371176
## [34] train-rmse:0.367533
## [35] train-rmse:0.363934
## [36] train-rmse:0.360517
## [37] train-rmse:0.357096
## [38] train-rmse:0.353764
## [39] train-rmse:0.352232
## [40] train-rmse:0.348980
## [41] train-rmse:0.345555
## [42] train-rmse:0.342174
## [43] train-rmse:0.339241
## [44] train-rmse:0.336012
## [45] train-rmse:0.332719
## [46] train-rmse:0.330280
## [47] train-rmse:0.327203
## [48] train-rmse:0.324124
## [49] train-rmse:0.320942
## [50] train-rmse:0.317802
## [51] train-rmse:0.314916
## [52] train-rmse:0.312056
## [53] train-rmse:0.309000
## [54] train-rmse:0.306146
## [55] train-rmse:0.303145
## [56] train-rmse:0.300965
## [57] train-rmse:0.298020
## [58] train-rmse:0.295145
## [59] train-rmse:0.292491
## [60] train-rmse:0.289984
## [61] train-rmse:0.287465
## [62] train-rmse:0.284759
## [63] train-rmse:0.282080
## [64] train-rmse:0.279484
## [65] train-rmse:0.276756
## [66] train-rmse:0.274052
## [67] train-rmse:0.272105
## [68] train-rmse:0.269571
## [69] train-rmse:0.266943
## [70] train-rmse:0.264335
## [71] train-rmse:0.261917
## [72] train-rmse:0.259475
## [73] train-rmse:0.256950
## [74] train-rmse:0.254480
## [75] train-rmse:0.252008
## [76] train-rmse:0.249851
## [77] train-rmse:0.247587
## [78] train-rmse:0.245171
## [79] train-rmse:0.242807
## [80] train-rmse:0.240453
## [81] train-rmse:0.238108
## [82] train-rmse:0.235800
## [83] train-rmse:0.233528
## [84] train-rmse:0.231270
## [85] train-rmse:0.229246
## [86] train-rmse:0.227162
## [87] train-rmse:0.226059
## [88] train-rmse:0.223979
## [89] train-rmse:0.221808
## [90] train-rmse:0.219652
## [91] train-rmse:0.217669
## [92] train-rmse:0.215563
## [93] train-rmse:0.213624
## [94] train-rmse:0.211550
## [95] train-rmse:0.210330
## [96] train-rmse:0.208669
## [97] train-rmse:0.206816
## [98] train-rmse:0.204811
## [99] train-rmse:0.202835
## [100] train-rmse:0.201153
#eta=learning rate, colsample_bytree denes what percentage of features (columns)k# will be used for building each tree#DISPLAYING FEATURE IMPORTANCEprint(xgb.importance(colnames(X_train), model=xgb.reg))## Feature Gain Cover Frequency
## 1: Sugars (g) 0.512901628 0.23512479 0.08193980
## 2: Cholesterol (mg) 0.240030685 0.18713799 0.10033445
## 3: Calories 0.114895531 0.17797592 0.16053512
## 4: Total Carbohydrates (g) 0.049664692 0.12044090 0.14214047
## 5: Total Fat (g) 0.025440894 0.06371327 0.14381271
## 6: Protein (g) 0.017270739 0.05009302 0.08361204
## 7: Trans Fat (g) 0.011239336 0.05132166 0.07357860
## 8: Caffeine (mg) 0.010333830 0.05321726 0.08193980
## 9: Dietary Fibre (g) 0.007736928 0.02667884 0.04515050
## 10: Sodium (mg) 0.005726037 0.01786780 0.04515050
## 11: Saturated Fat (g) 0.004759701 0.01642855 0.04180602
#Prediction accuracy for testing dataprediction.y<-predict(xgb.reg,X_test) #The numbers are not binary classification#so we use a simple transformation shown at the code below#accuracy within 10%accuracy10<- ifelse(abs(y_test-prediction.y)<0.10*y_test,1,0)print(sum(accuracy10)/length(accuracy10))## [1] 0
#accuracy within 15%accuracy15<- ifelse(abs(y_test-prediction.y)<0.15*y_test,1,0)print(sum(accuracy15)/length(accuracy15))## [1] 0.125
#Transform this regression into a binary classificationprediction_binary<-as.numeric(prediction.y>0.5)print(head(prediction_binary))## [1] 1 1 1 0 0 1
#Model performance errorerror <- mean(as.numeric(prediction.y > 0.5) != testing$healthy)print(paste("test-error=", error))## [1] "test-error=0"
The test error is 0, which indicates that model did pretty well with the predictions. Meaning the model made great predictions on the test set in this context
cm<-table(testing$healthy, as.numeric(prediction.y > 0.5))cmNote that the echo = FALSE parameter was added to the code chunk to prevent printing of the R code that generated the plot.